In the Journal of Biomechanics, Camargo et al. introduce a novel dataset containing information from kinematics and kinetics and power at different conditions of locomotion, including walking on treadmill, level ground, stairs ascending, and descending, ramp ascending, and descending. The dataset serves as a detailed compendium of information to establish a characterization of community ambulation on multiple contexts of walking speed, stairs height and ramp inclination. In addition to the biomechanics information, we provide the signals of wearable sensors including IMU, EMG and goniometers. This dataset offers a much-needed source of individual trials containing kinematics, kinetics and power together with sensor signals during human locomotion. See below to get more details about the experiment in the interactive display, or just go ahead and (get the dataset!)
Terrain contexts
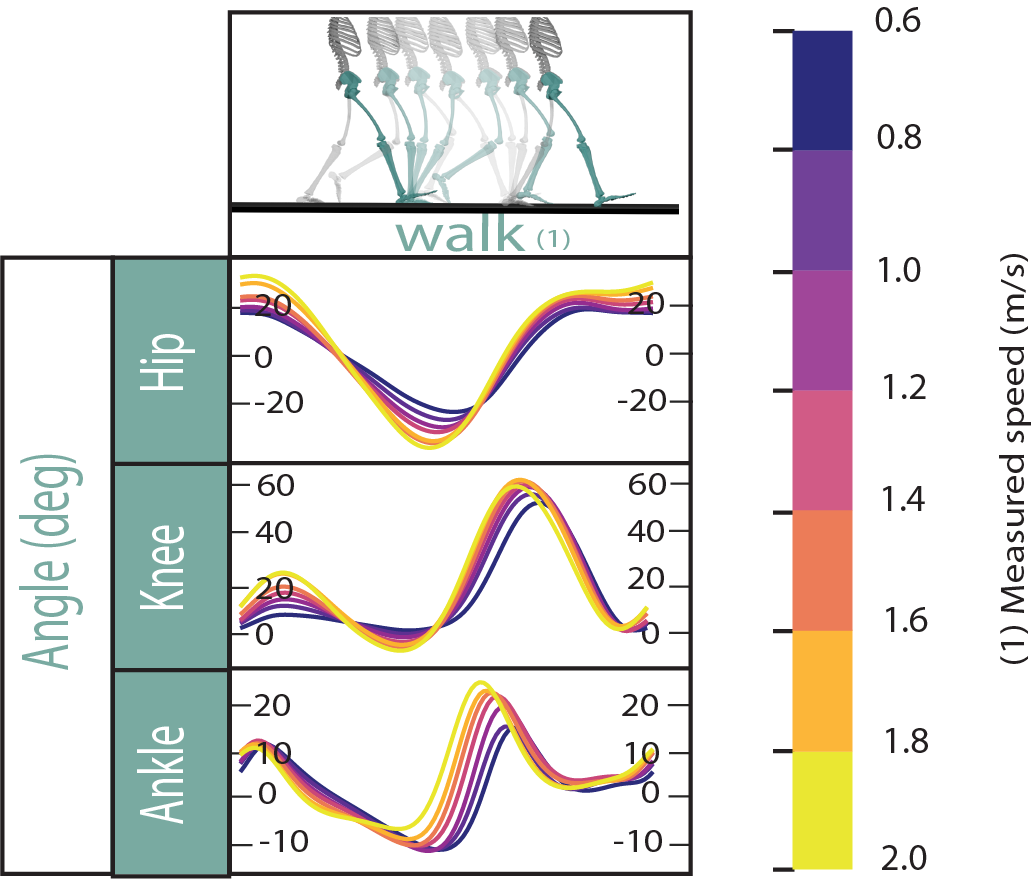
The dataset contains the locomotion in multiple contexts, including: different heights of stairs, inclination of ramps, speed of levelground and treadmill.
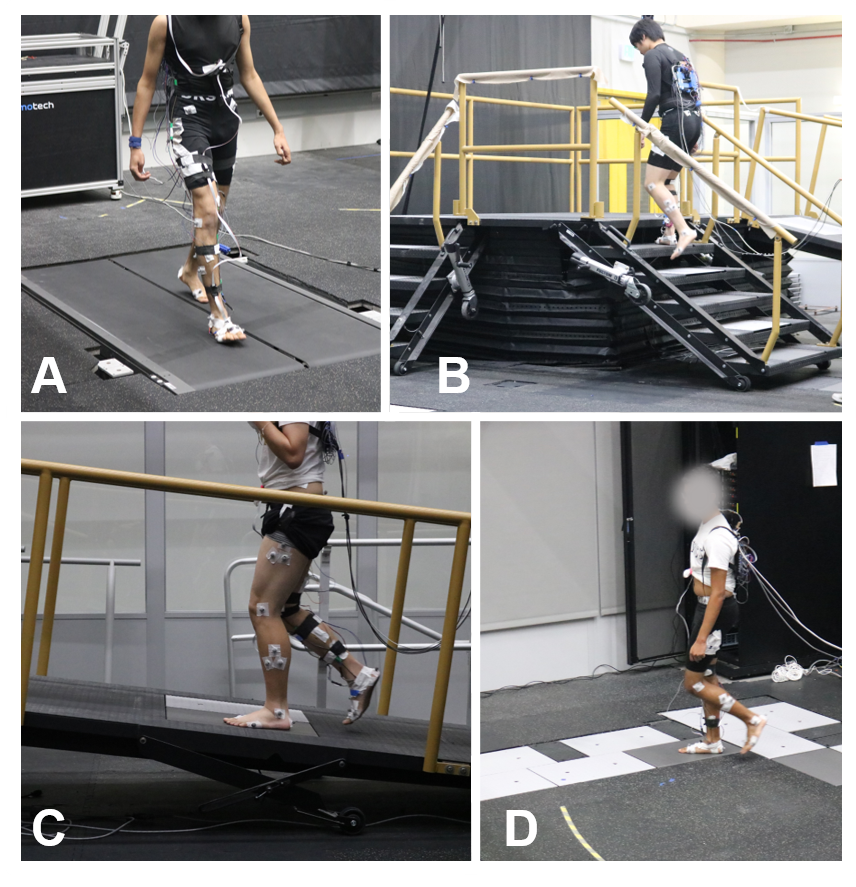
The experiment consisted of N=22 healthy subjects performing locomotion trials in four different terrain types: treadmill, level ground, ramp and stairs.
Subjects were instrumented using wearable sensors, motion capture and forceplates.
Motion capture data was processed using our matlab toolbox MoCapTools that integrates a gap filling method and user friendly API to interface with C3D files and 
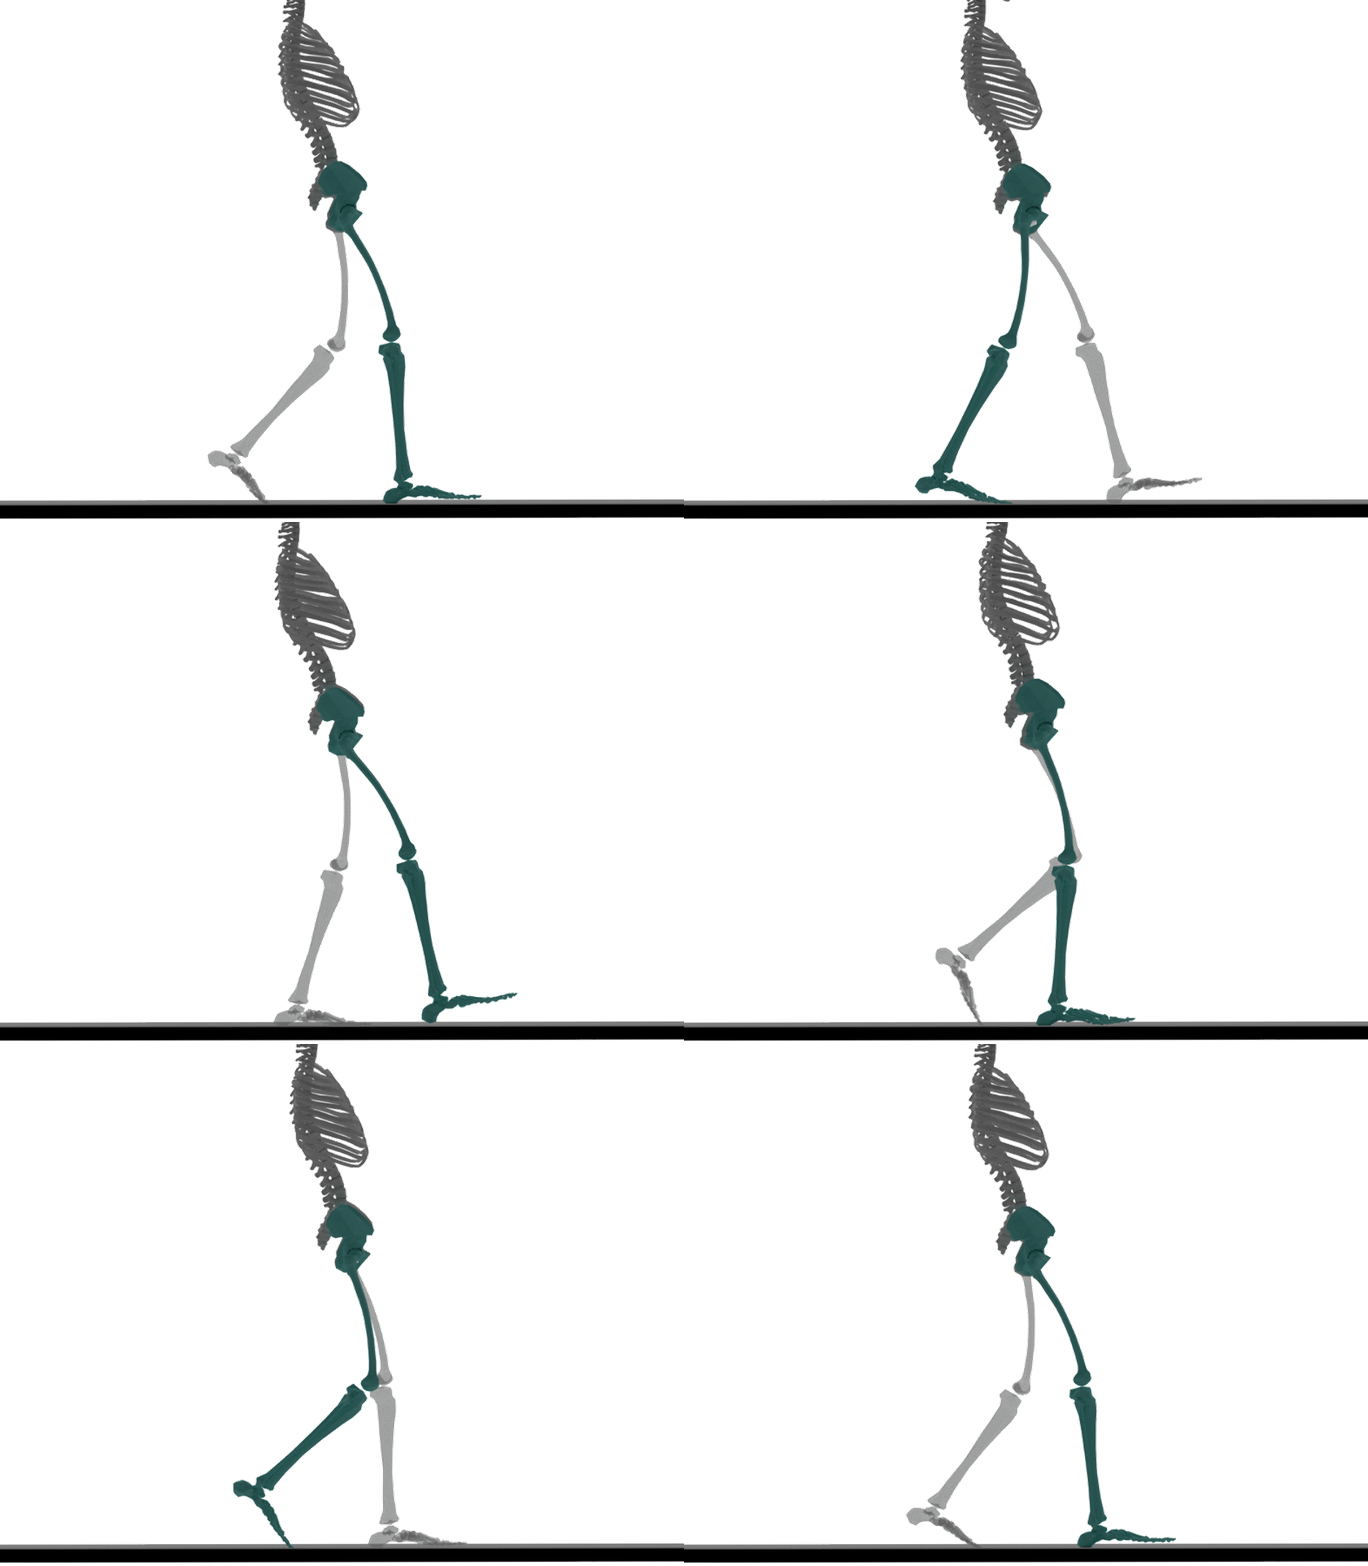
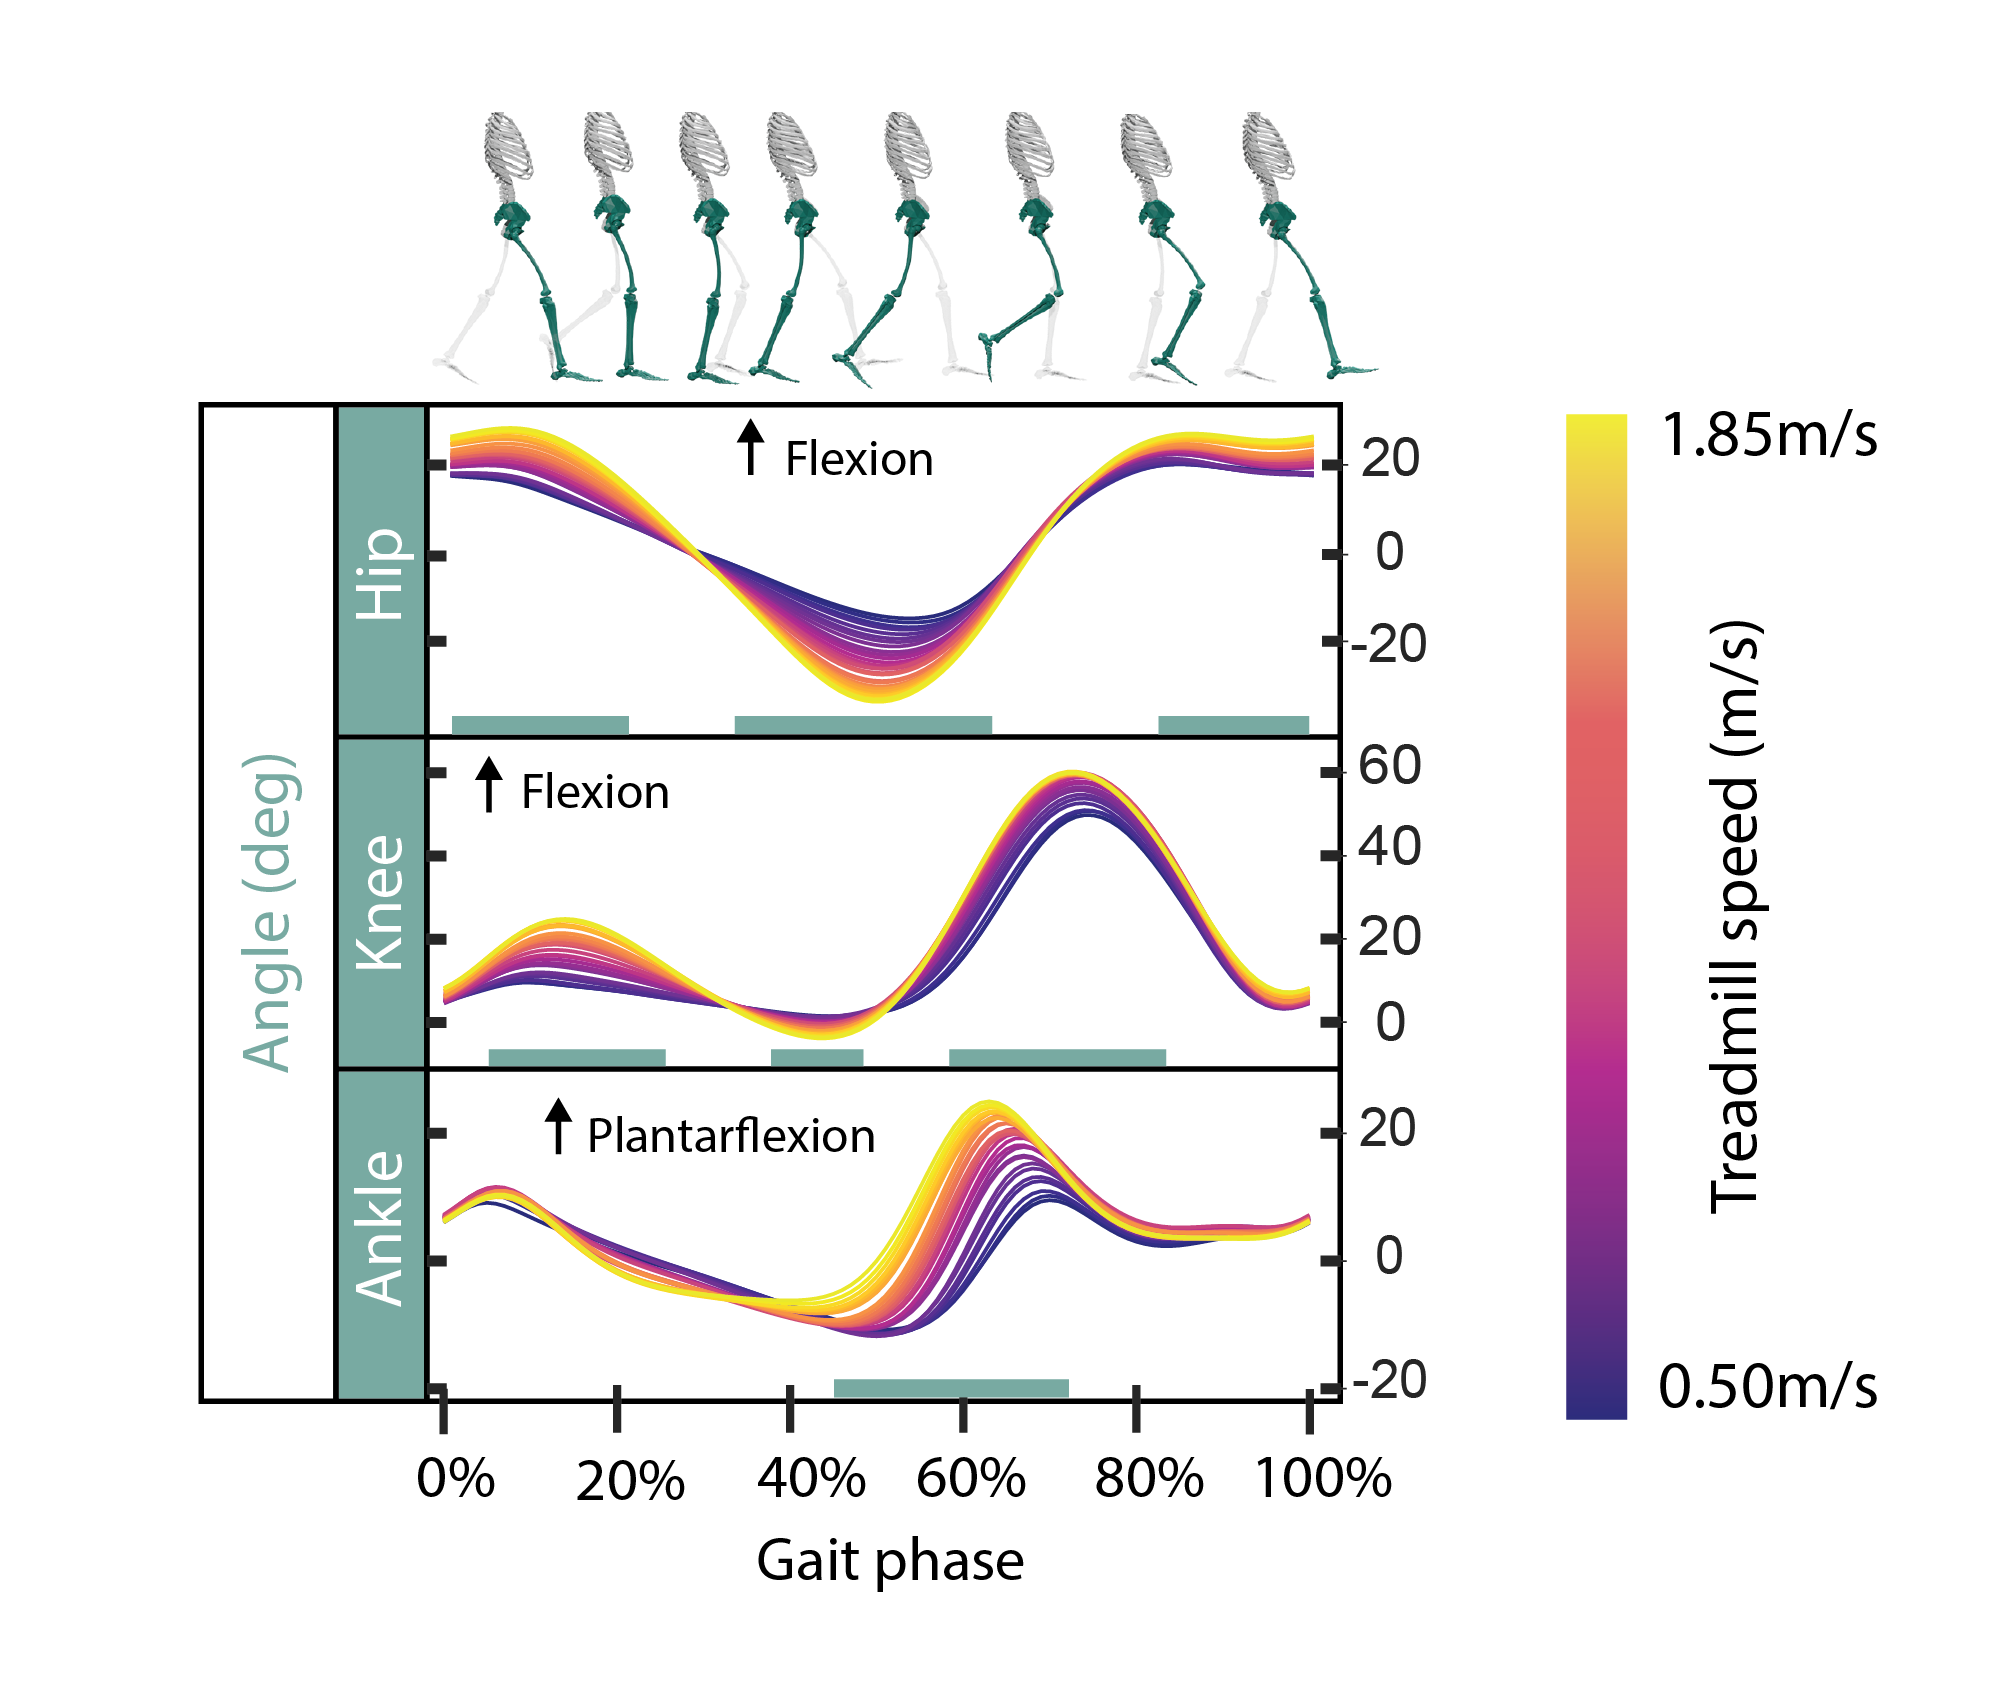
Treadmill walking data was recorded on intervals of 30 seconds at each of 28 different speeds ranging from 0.5 to 1.85m/s with increments of 0.05m/s. This gives a detailed resolution as it has not been reported before. The figure shows the average kinematics of walking on treadmill computed from the dataset.

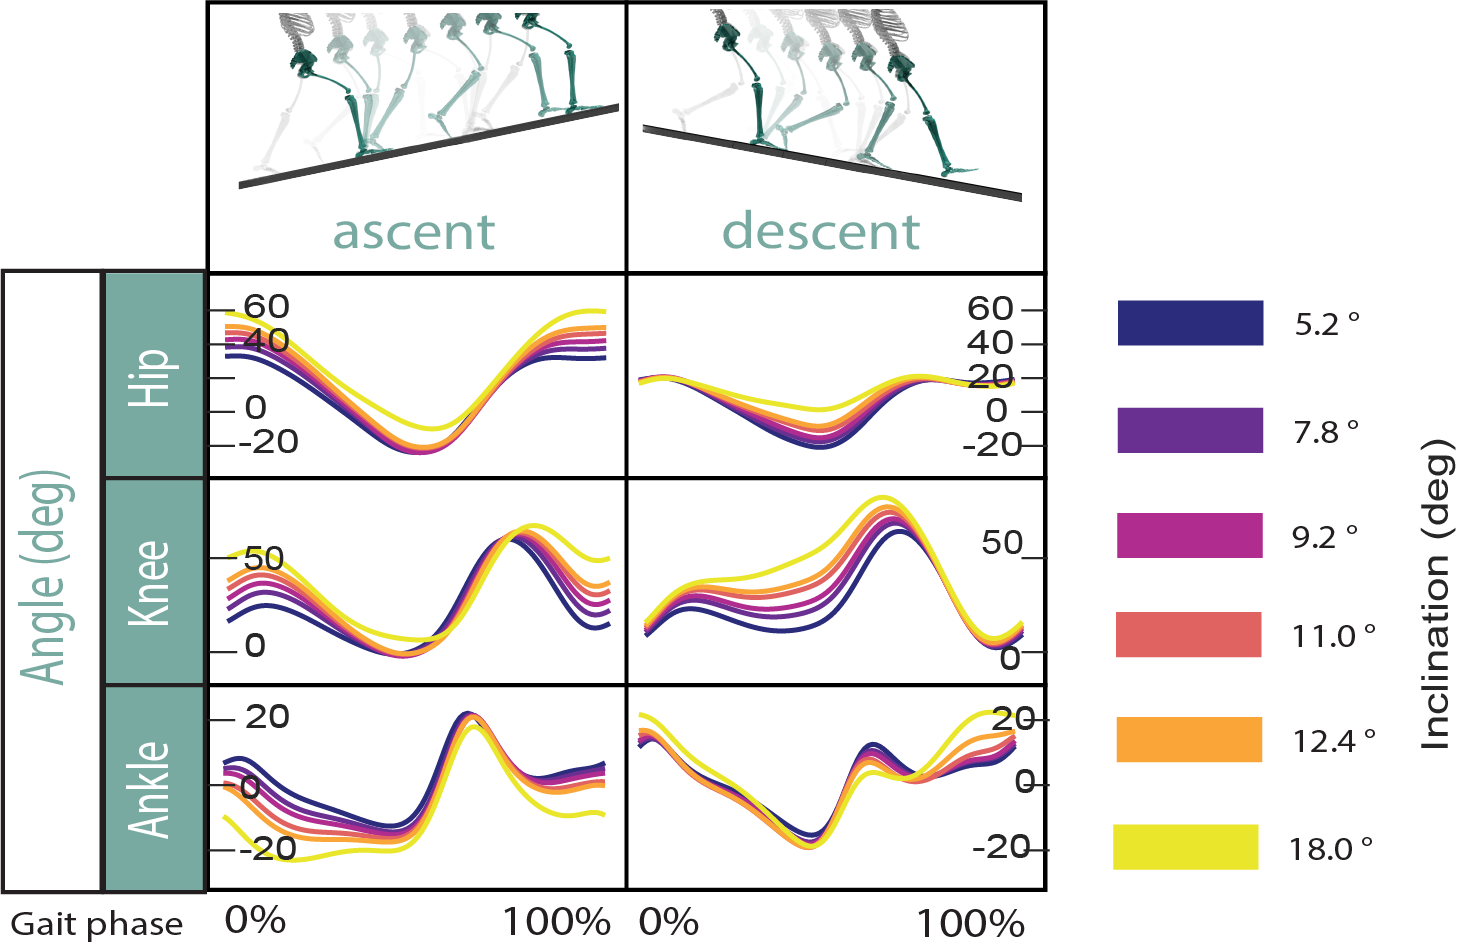
Ramp trials were executed at each of 6 inclinations of 5.2°, 7.8°, 9.2°, 11°, 12.4° and 18° Including ramp ascend, ramp descend, and their transitions from/to walk.
The plot shows sample of average profiles computed from the dataset.
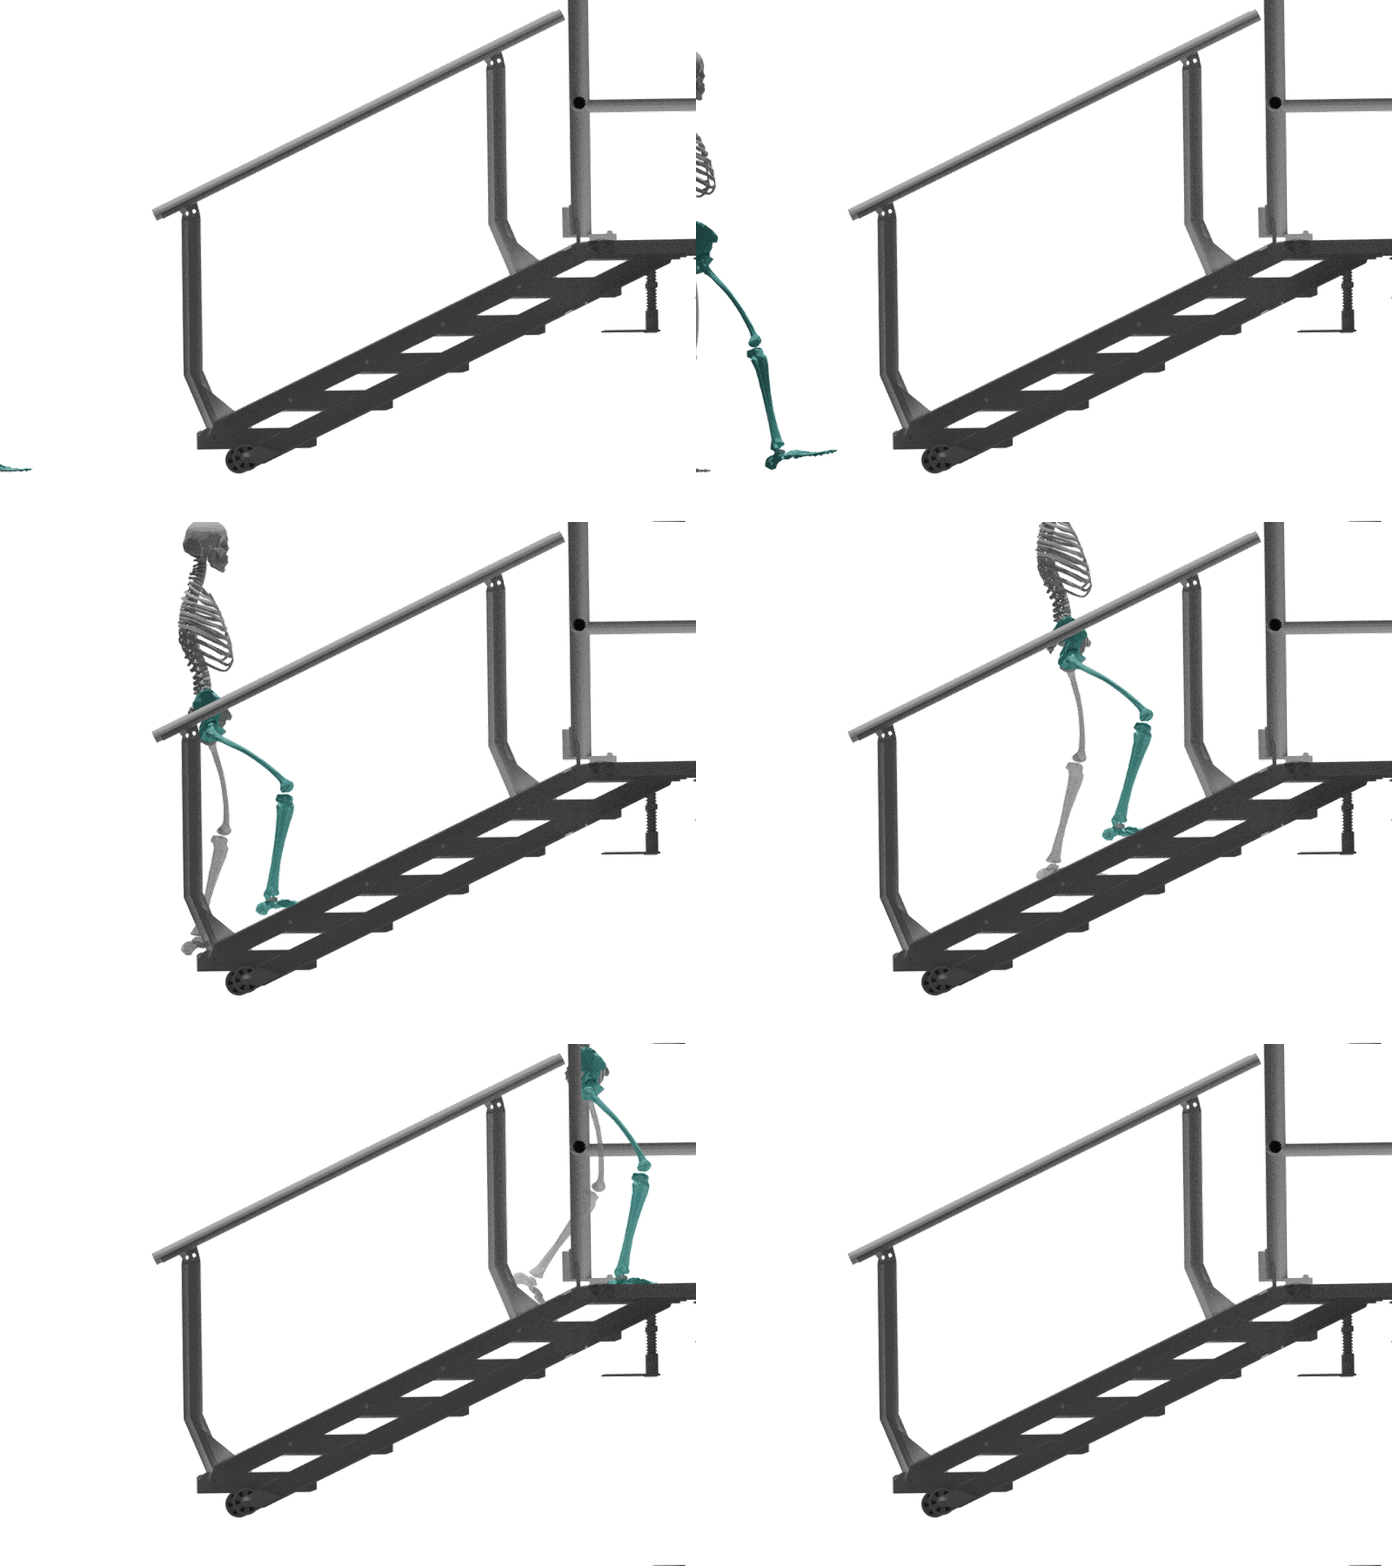
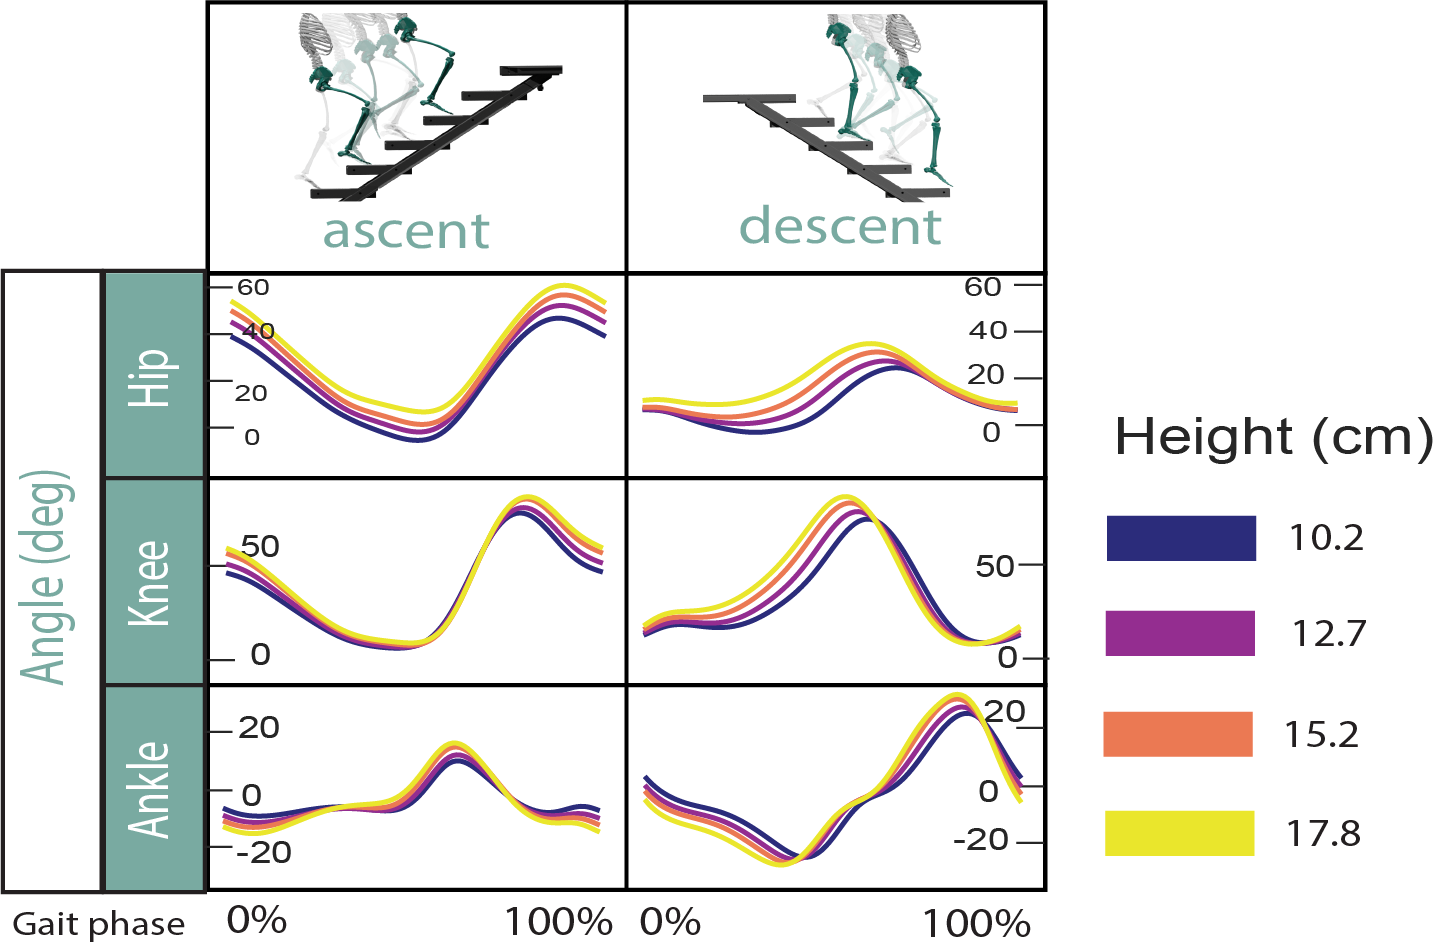
Stairs trials were executed at each of four different step heights within the range of ADA accessibility Guidelines [ref]: 10.16cm (4in), 12.70cm (5in), 15.24cm (6in), 17.78cm (7in).
The image presents a sample of the data.
Sensors
The data collected includes EMG, IMU, goniometers, motion capture markers and forceplates. Check the interactive layout to see more information about each sensor and information contained in the dataset.
Wearable sensors instrumented the locomotion, using the following sensors:
| EMG | Goniometer | IMU | Markers | force plates |
IMUs are placed on the trunk, thigh, shank and foot.
They capture acceleration and gyro data is the X,Y and Z directions.
EMG electrodes are placed on the following muscle groups:
| Gastroc medialis | Tibialis Anterior | Soleus | Vastus medialis |
| Vastus lateralis | Rectus femoris | Biceps femoris | Semitendinosus |
| Gracilis | Gluteus Medius | Right external Oblique |
Goniometers measure the changes in the posture for the angles at the joints. They are placed on the following joint-DOF:
| Ankle sagittal | Ankle frontal | Knee sagittal | Hip sagittal |
Ground reaction forces were recorded using force plates located in the instrumented treadmill and level with the floor, ramp and stairs.
Data access is provided here with a public-view Dropbox directory (direct link). You can download the entire database or partial files. We recommend to download each subject individually (~1GB per subject)

